Dashboard Metrics
On the Chat Desk Dashboard, there are three tabs each containing useful metrics about Chat Desk activity:
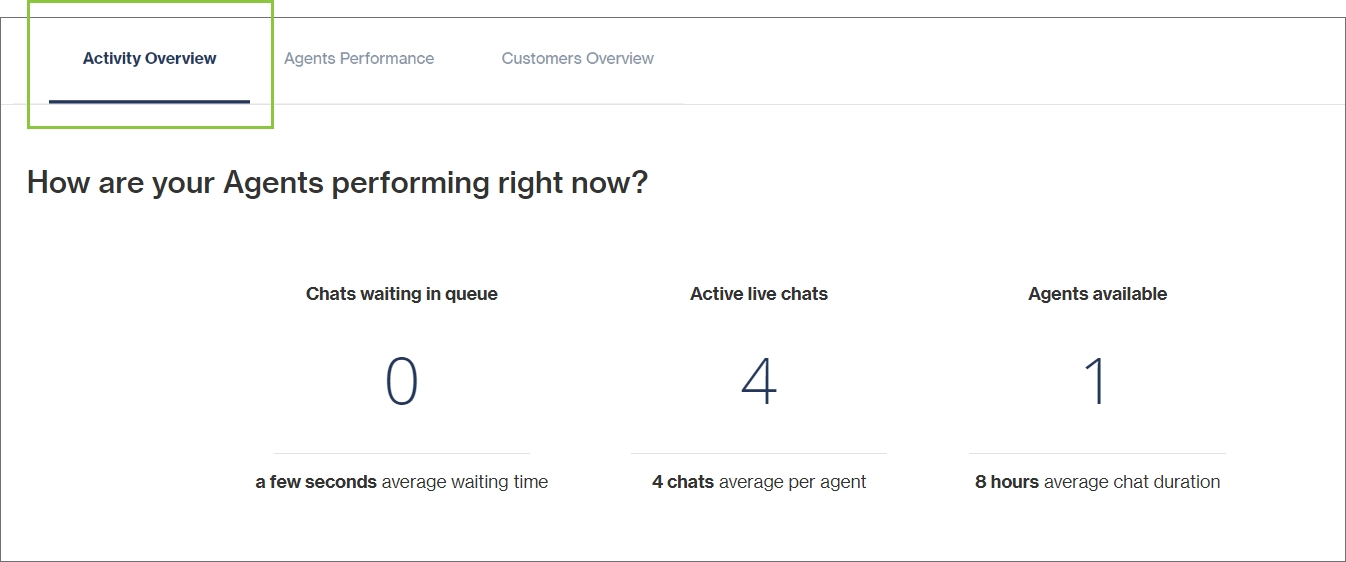
Activity Overview
Gives an overview of how your agents are performing and includes the following information:
Chats waiting in queue: The number of customers who wanted to engage with an agent but have not yet been assigned to one; including the average waiting time.
Active live chats: The number of chats that are currently active; including the average number of chats per agent.
Agents available: The number of agents that are currently available and can be assigned to a chat; including average chat duration.
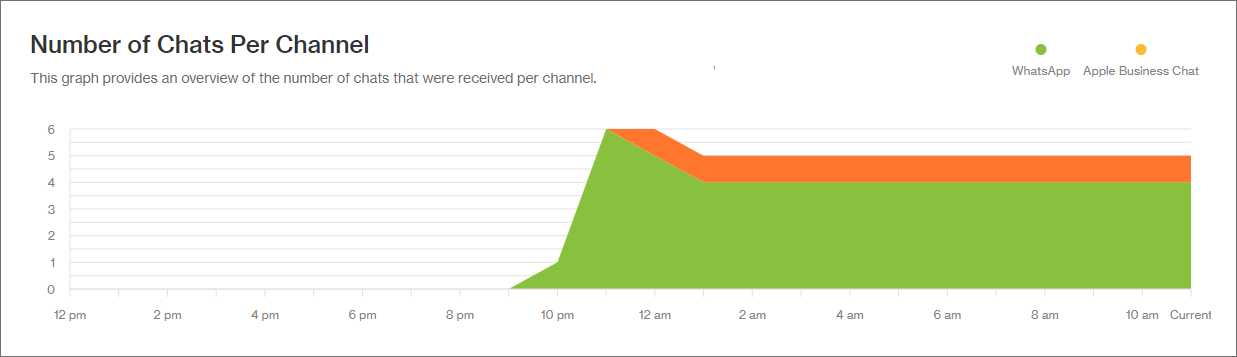
Number of chats per channel - A graphical overview of the number of chats that were received per channel.
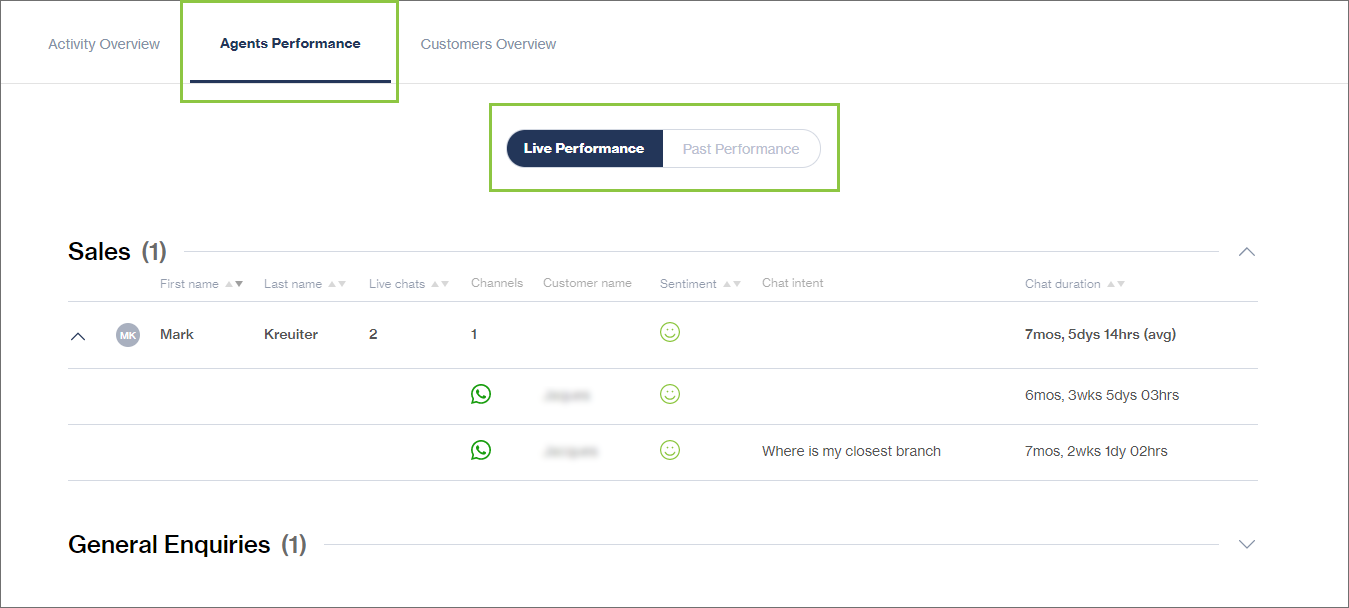
Agents Performance
Gives an overview of your agents' activity. Agents are grouped by department (if set up). Expanding an agent's section gives a detailed view per individual chat.
Under Live Performance, information about the number of live chats and channels, the general sentiment of chats, and the average chat duration are indicated per agent that is currently active.
Sentiments must be configured for clients by Clickatell to ensure that the sentiment is accurately detected in conversations. If no emotes are configured, the sentiment will always be detected as positive/neutral.
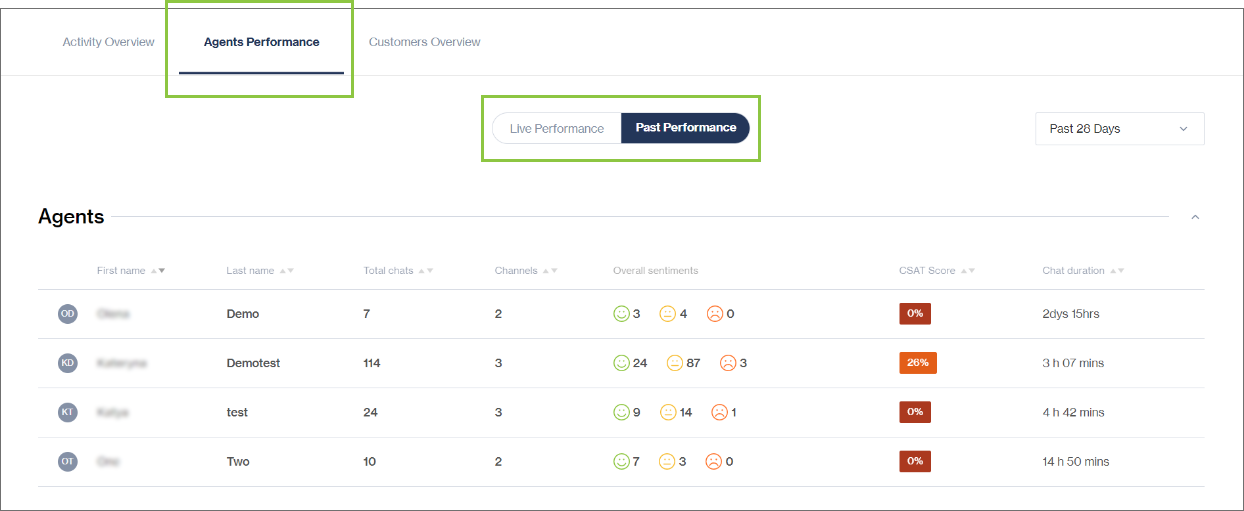
You can also view how agents have performed in the past by selecting the Past Performance tab. Agents are grouped by department, and you can filter by time frame (1-28 days).
The Customer Satisfaction (CSAT) Ratings Per agent enable Supervisors to monitor an agent's performance based on how their service level was rated by the customers they've interacted with. These ratings allow your Supervisors to manage and coach agents where necessary and reward those who are performing well.
CSAT ratings apply to the CSAT survey only. CSAT ratings per agent are only shown if a survey was activated on your Chat Desk account.
The CSAT rating per agent is calculated using industry-standard calculations for CSAT ratings to derive an overall percentage rating. On the Chat Desk Dashboard, these ratings are classified as follows:
0% - 25% - Red: "Poor" rating
25.1% - 50% - Amber: "Bad" rating
50.1% - 75% - Yellow: "Fair" rating
75.1% - 100% - Green: "Good" rating
Customers Overview
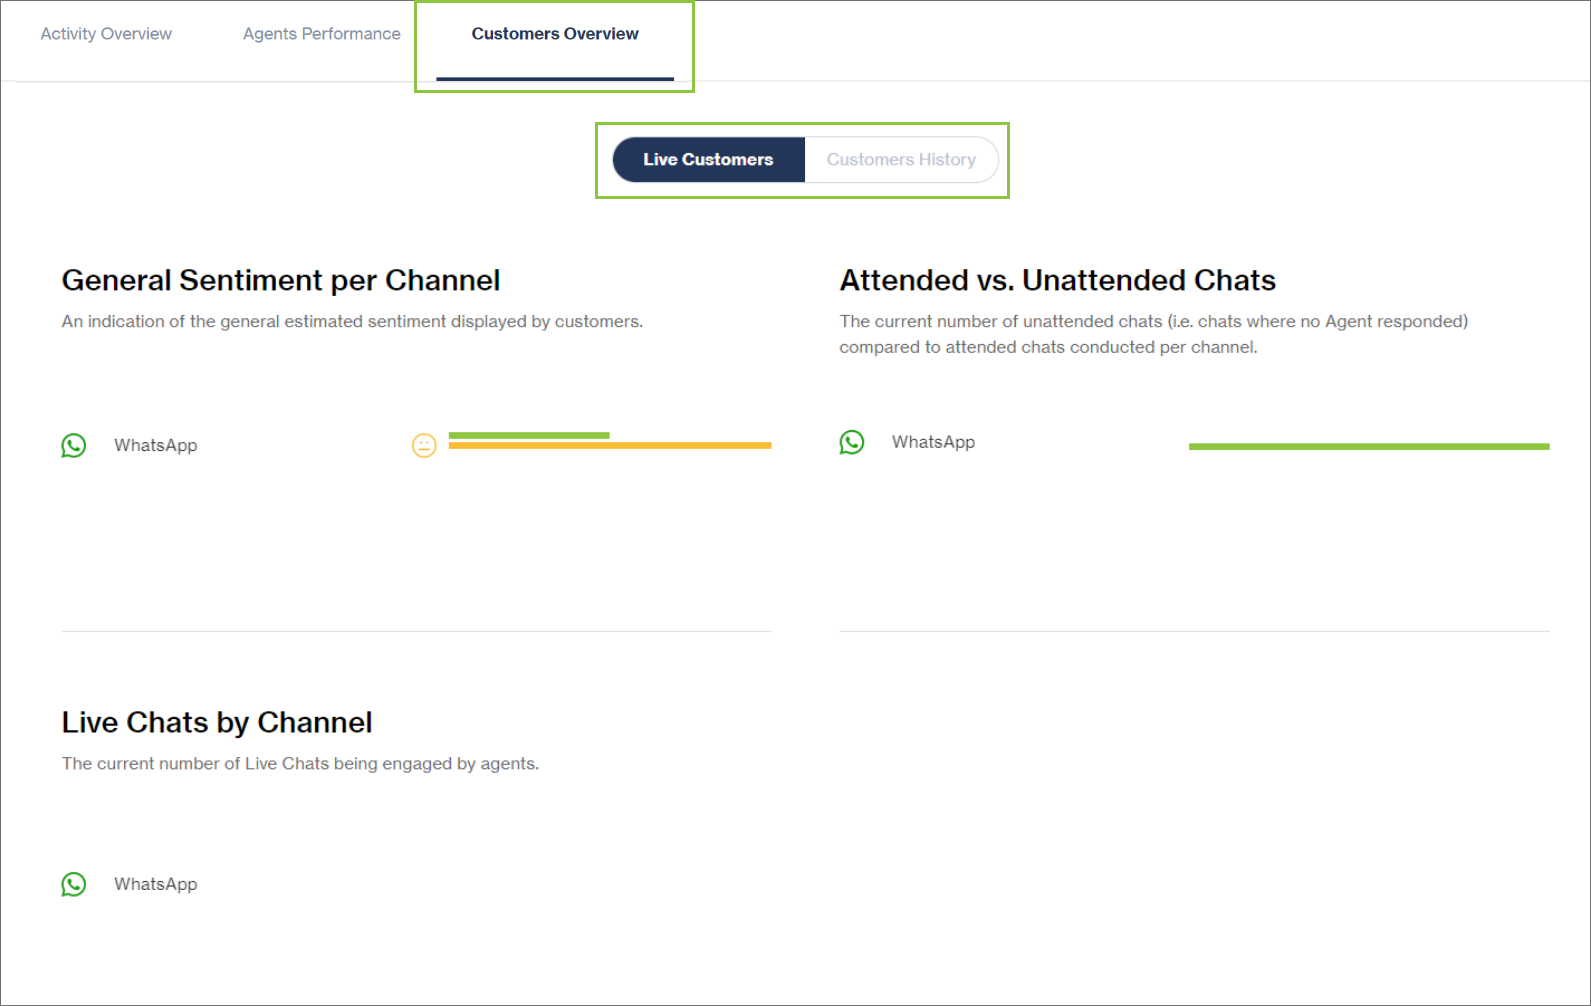
Under Live Customers, you can view data relating to customers that are currently engaged in live chats for the past 24 hours, broken down per channel:
General sentiment: An indication of the general estimated customer sentiment (positive, neutral, negative).
Attended vs unattended chats: The current number of unattended chats (i.e., chats where no agent has responded yet) compared to attended chats.
Live chats: The current number of live chats.
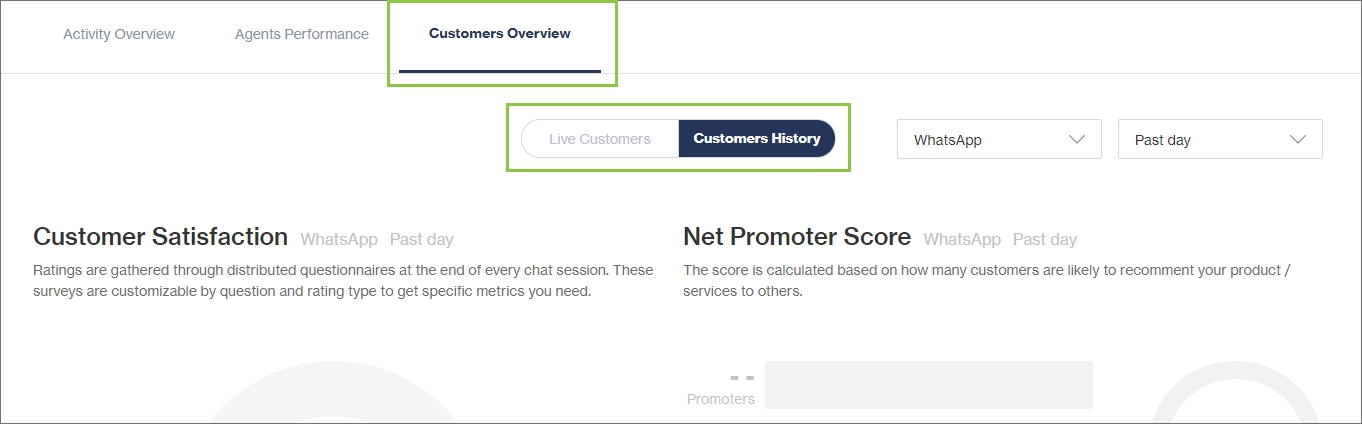
The Customers History tab shows:
Customer Satisfaction ratings and graph: Demonstrates your customers' overall satisfaction based on surveys, happiness, and other metrics (if set up under Surveys).
Net Promoter Score and graph: Based on how many customers are likely to recommend your product/services to others (if set up under Surveys).
Live chats by channel: Breakdown of how your customers are engaging with you via all the different channels.
Past sentiment: Demonstrates your customer’s sentiments over a period of time.
You can filter the results based on the channel and time frame.
Data will only be represented for the survey that has been enabled. So only one report will be populated with data unless you alternate between survey types.
Last updated